

In economics, the term “Demand” refers to the desire for goods and services backed by the purchasing power and the willingness to purchase. Mere “Desire” for products does not reflect in the market. The demand supported by the purchasing power is termed as the “Effective demand”. Hence, the demand for a good can be defined as “the quantity demanded of a good or a service that will be bought by the consumers over a period of time at any given price”.
The demand for a product is considered as a dependent variable that will change with the change in some other factors. Following are some of the factors determining the demand for a product.
- Price of the product
- Prices of other products
- Consumer’s income
- Consumer’s taste
- Government policies
- Other factors such as weather conditions, social, cultural, and political, etc.
The market demand for a product is the horizontal summation of all the individual demand schedules.
Based on the nature of the effect of the above factors on demand, they can be classified into two groups.
- Effects of the changes in the price of the product while all the other factors remain constant.
- Effects of the changes in any of the other factors except the price of the product while all the other factors remain constant.
- Price of the product
This is the most important factor that influences the demand for a product. The quantity demanded of a product and the price of the same are having an inverse or negative relationship. There are two reasons that will determine the inverse relationship between the quantity demanded and the price of the product.
- Income effect
This explains the change in consumer’s real income with the change in the price of the product. When the price of the product increases the real income of the consumer decreases and fewer units of the product can be purchased and vice versa.
2. Substitution effect
When the price of the product increases, the consumers look for substitute goods available at low prices.
The relationship between the price of the product and the quantity demanded can be illustrated by using a diagram as shown below.
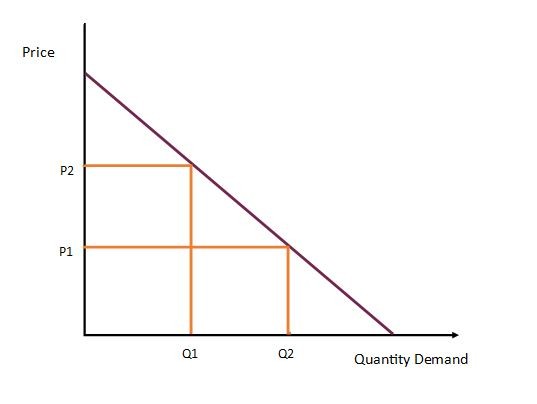
As per the above diagram, the ordinary demand curve slopes downwards from left to right showing the inverse relationship price of the product and the quantity demanded of same. At the price p1, q2 number of units are demanded, and an increase in price from p1 to p2 shows a contraction of demand from q2 to q1. As a result, the relevant point on the demand moves from point “a” to point ” b “along the demand curve.
- Other factors influencing demand
Changes in any other factors influencing demand except the price of the product can graphically be shown by shifting the demand curve. A positive change of the factor will shift the demand curve to “right” and the negative change will shift the same to “left”. While all the other factors remain constant, the change in consumer’s income can be observed by using a graph as below.
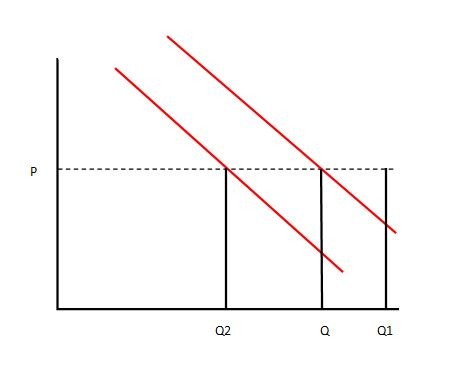
When the price of the product is “P” the consumer demands for “Q” number of units. Due to an increase in income, the quantity demanded increases from “Q” to “Q1” at the same price. This is shown by shifting the demand curve from “D” to “D1”. In the same way, when the consumer’s income falls, the quantity demanded has come down from “Q” to “Q2” by shifting the demand curve from “D” to “D2”. It is obvious that the movement of the demand curve shows the influence of factors other than the price of the product on demand.
The above is the situation in the case of normal goods with some limitations. But the goods considered as inferior goods or goods of social prestige, the opposite will take place.